

Hybrid Observability for the Agentic AI Era
Prevent disruptions, resolve issues faster, and safeguard critical services with the unified observability platform built for predictive, AI-powered IT operations.
Request a Demo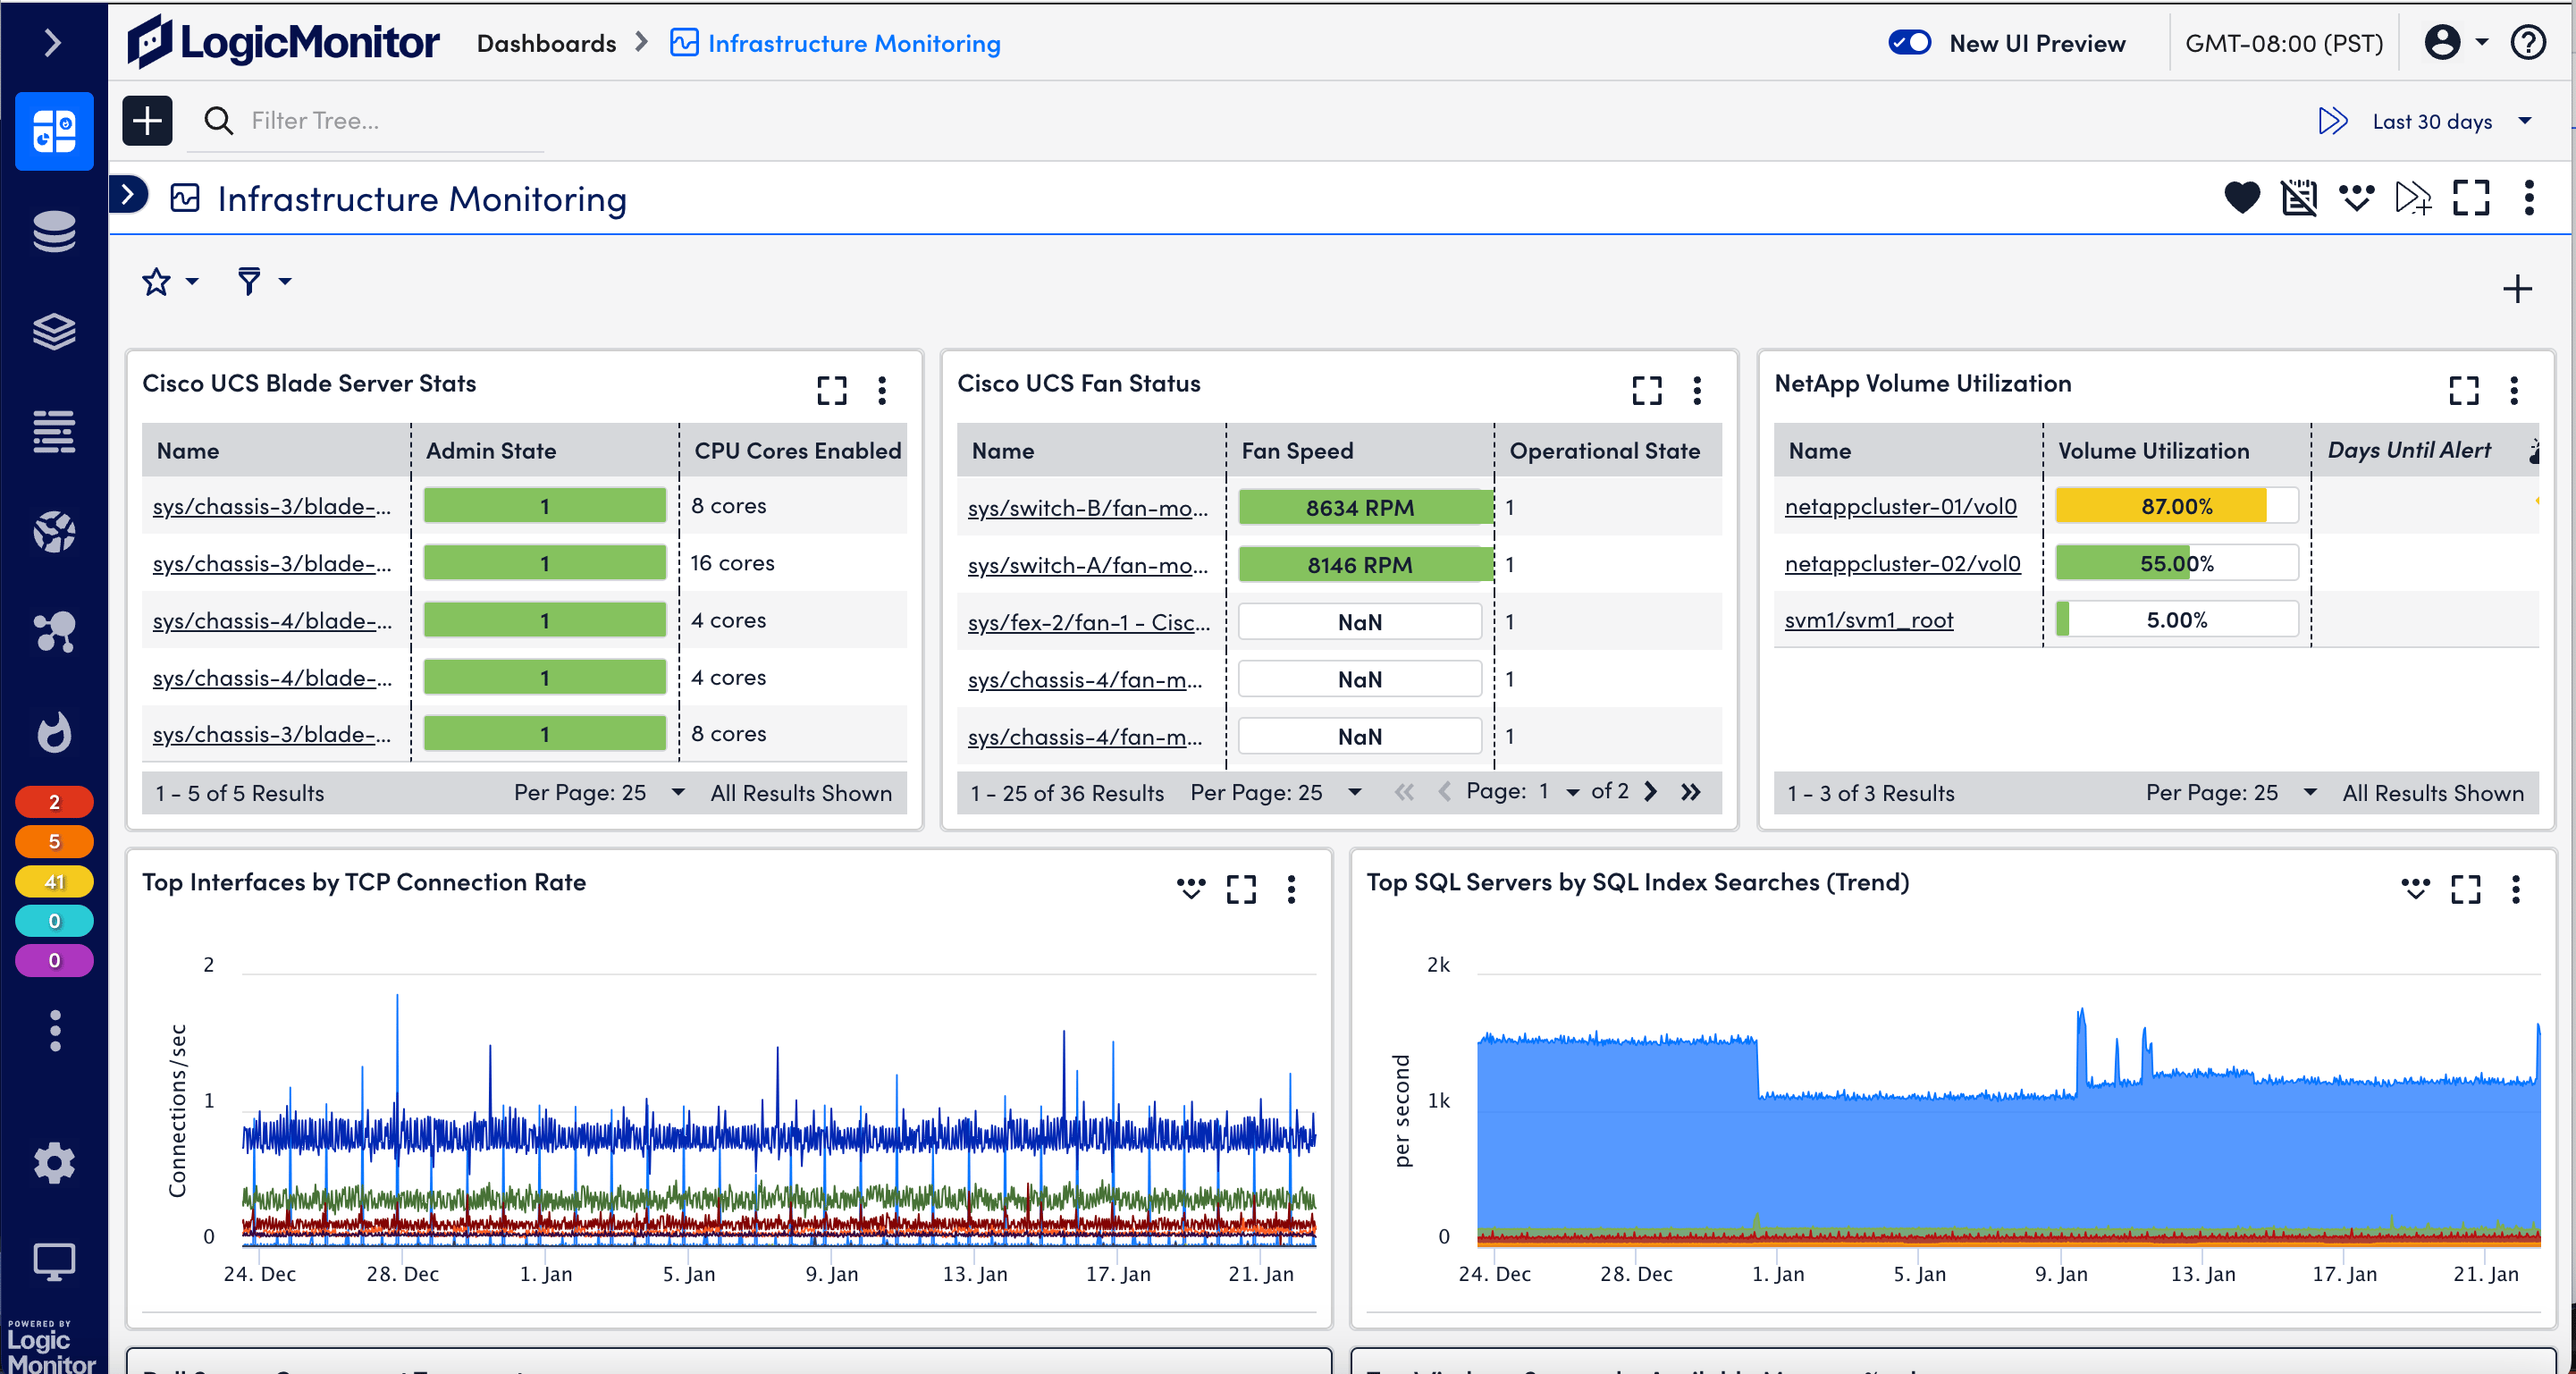
Trusted by Admired Brands Around the World


The Platform that Empowers CIOs to Deliver Business Transformation
LogicMonitor Envision offers end-to-end observability across the modern data center.
Infrastructure Monitoring
Empower your team with contextual visibility into your ever expanding and dynamic IT landscape
Learn More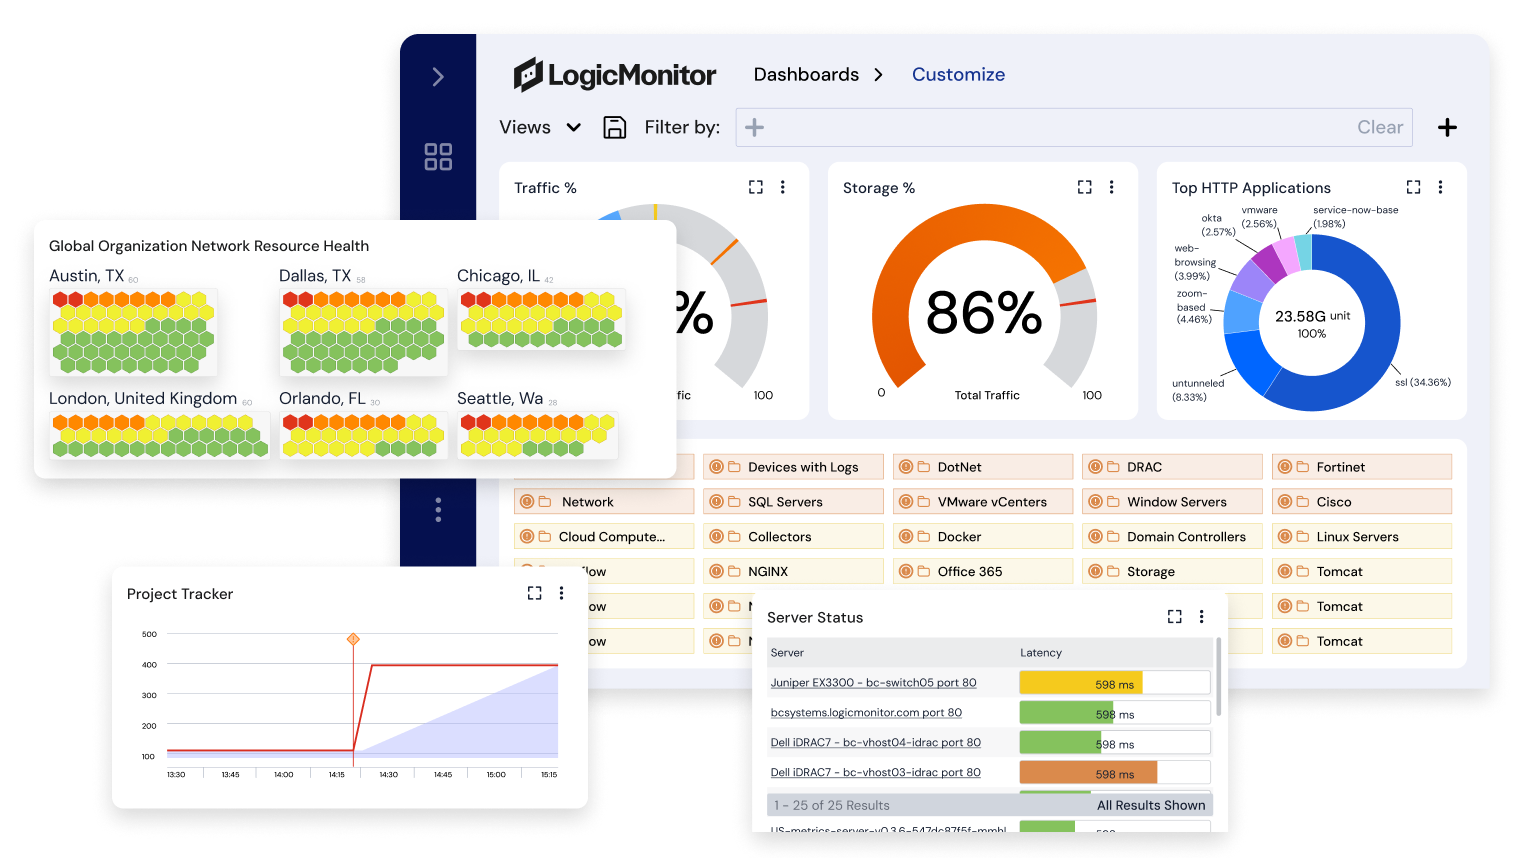
Features:


Agentic AIOps with Edwin AI
Don't wait for a failure to trigger a response, anticipate, act, and adapt before issues escalate
Learn More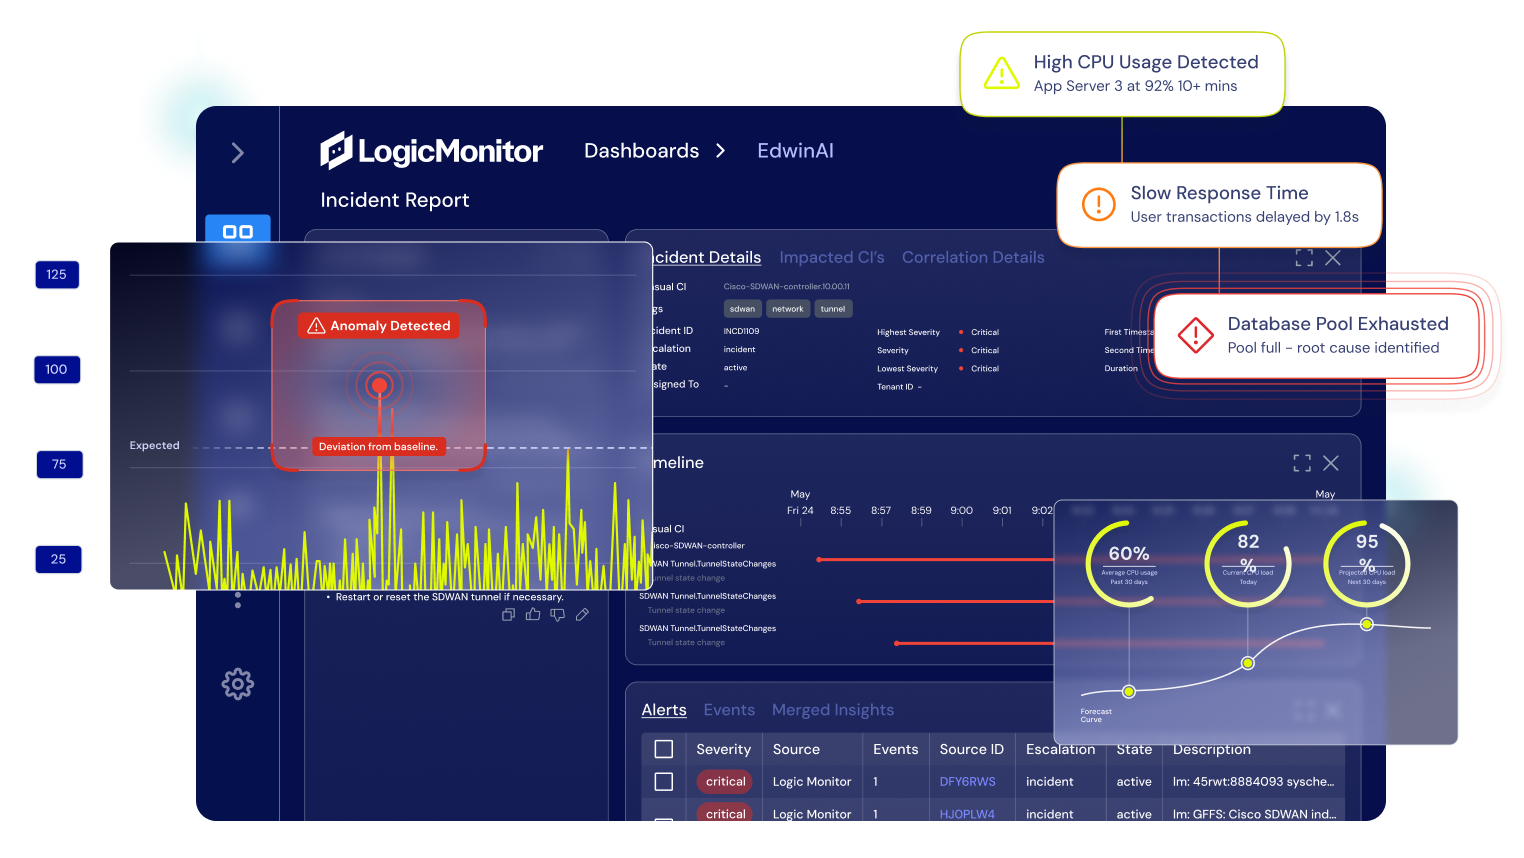
Features:


Cloud and Multi-Cloud
Maximize your investment in AWS, Azure, and GCP with real-time visibility into the performance of your cloud deployments
Learn More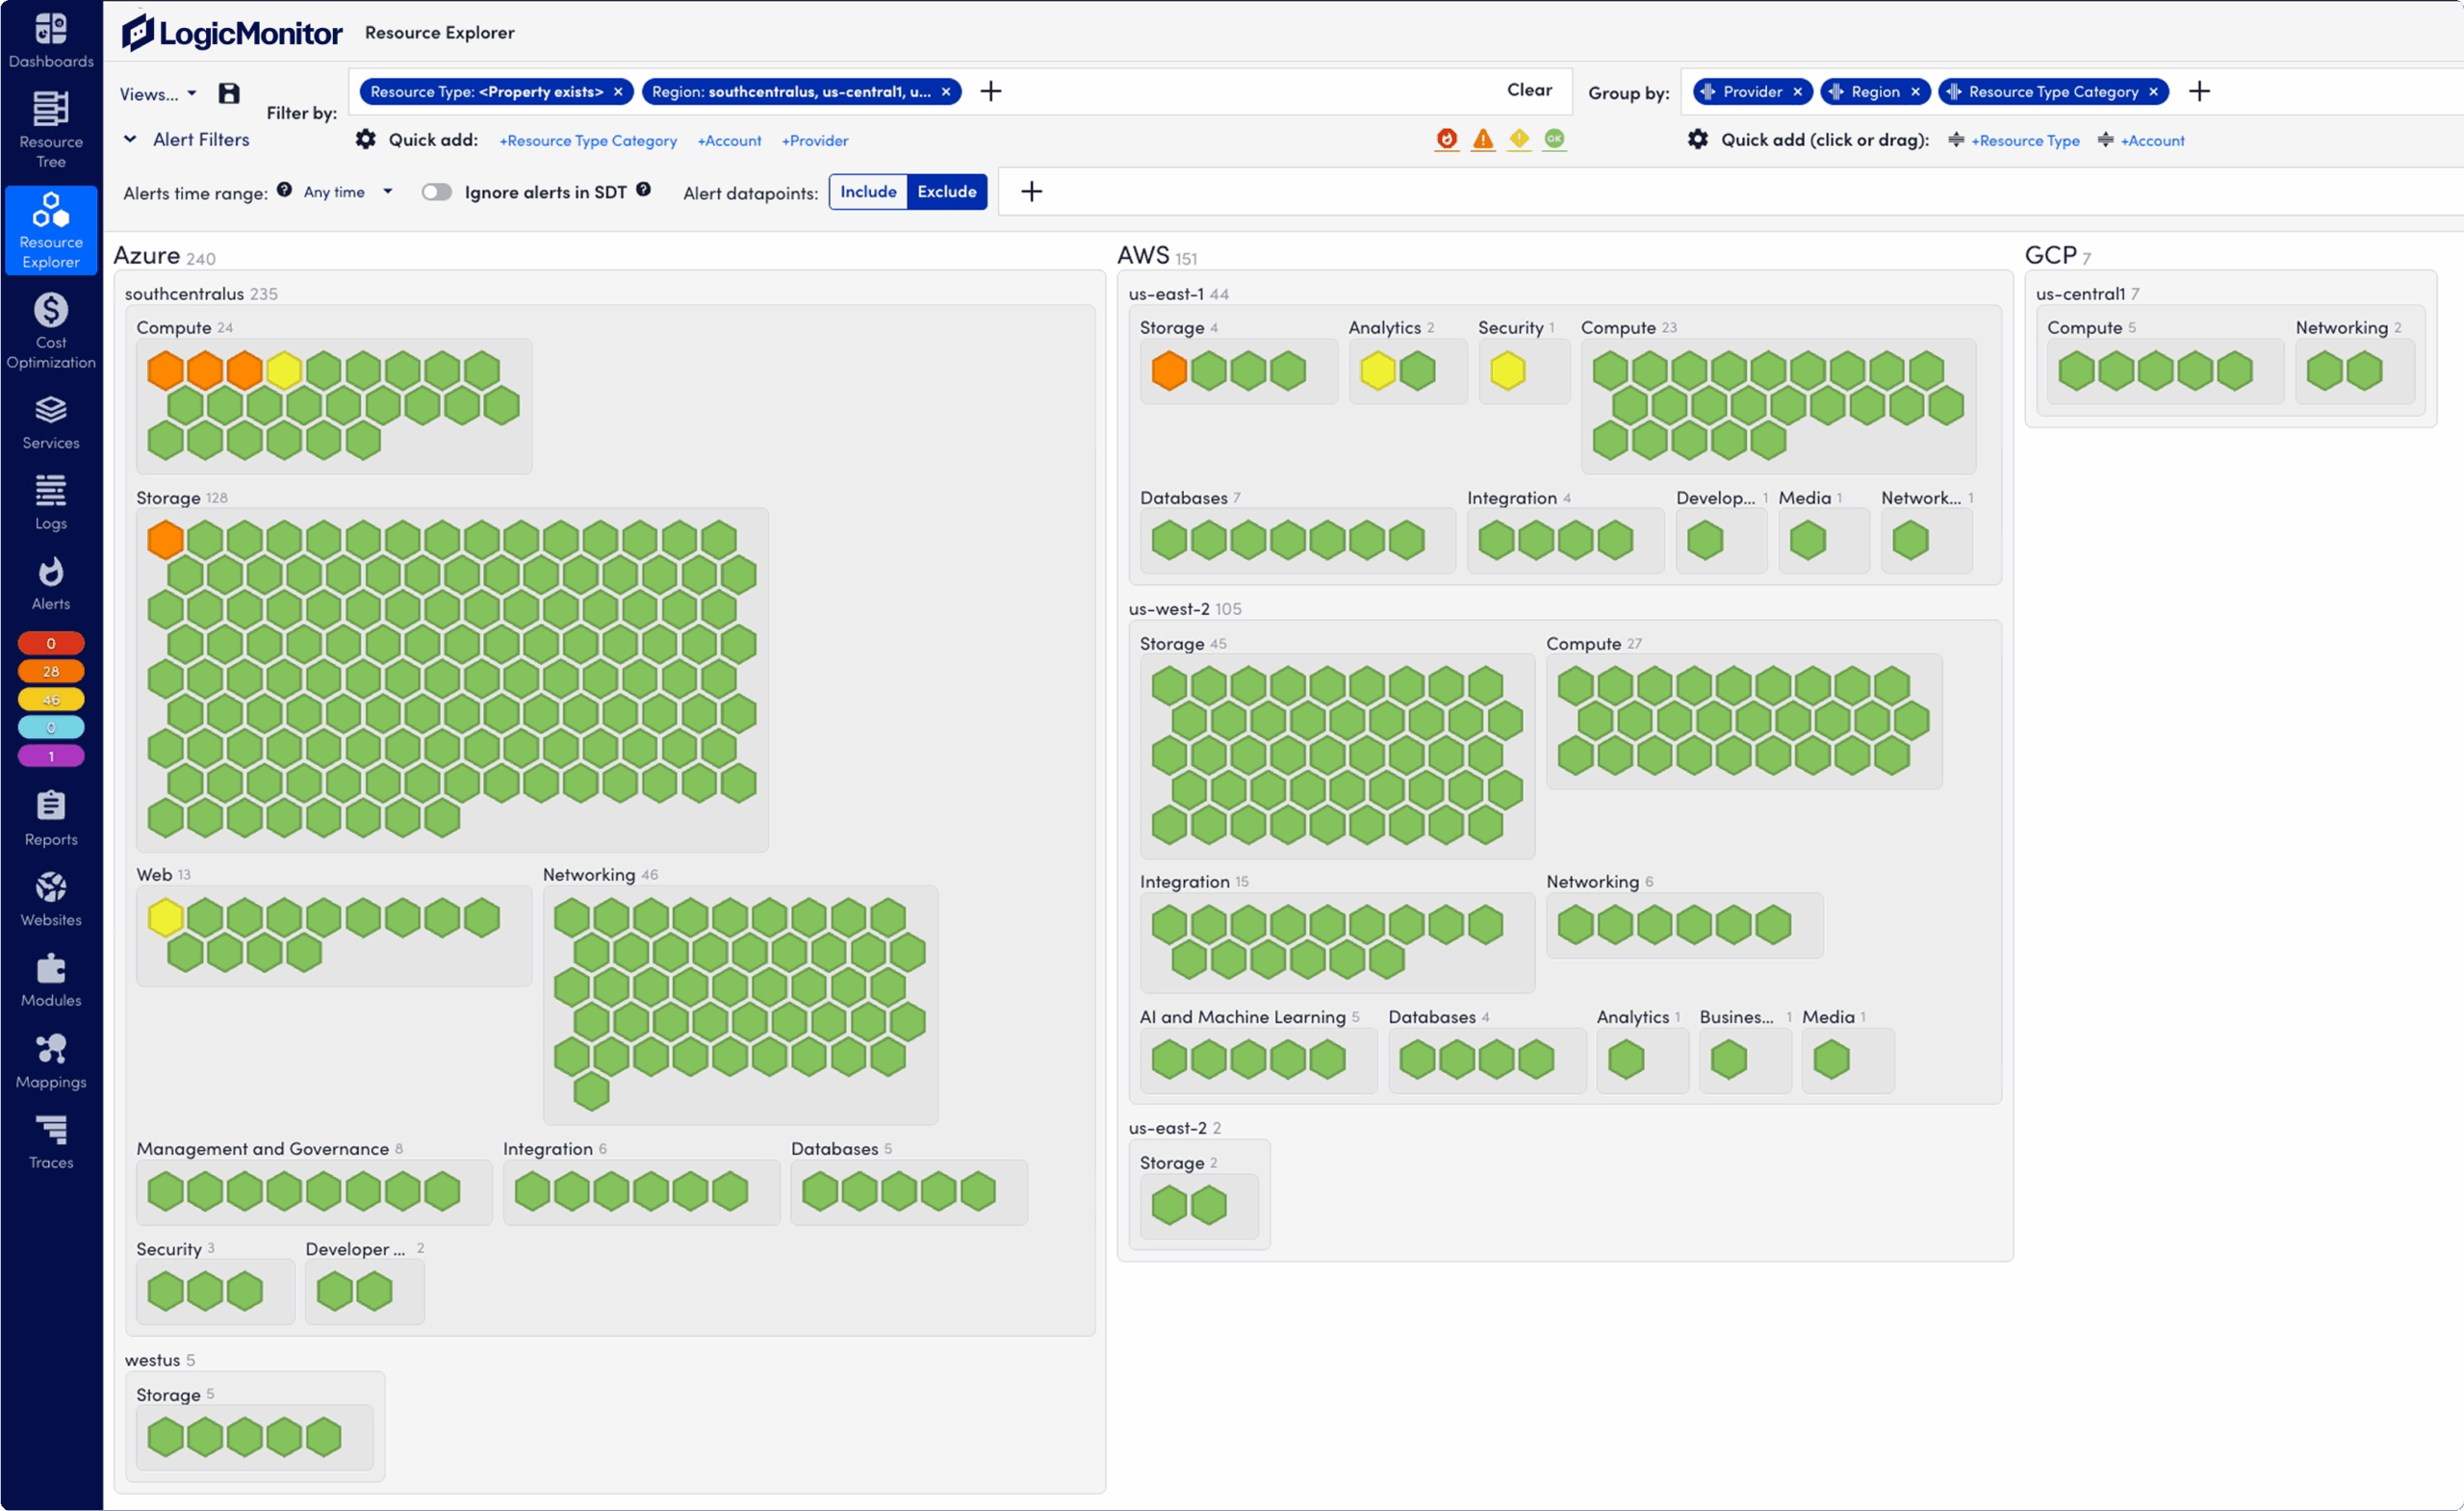
Features:


Solutions
Proactively manage modern hybrid environments with predictive insights, intelligent automation, and full-stack observability.
Learn MoreOffered:
Work faster, work smarter
LogicMonitor does the hard work for you with automated alert thresholds, AI-powered early warning capabilities, customizable escalation chains, workflows, and more.
Fuel for business acceleration
Embrace AIOps with LogicMonitor’s intelligent data forecasting, flexible reporting, and custom dashboards to provide insight that lets you automate responses based on trusted data.
Always ahead of the curve
We’re constantly rolling out product enhancements to address customer feedback and writing new integrations to keep pace with innovation.
Solutions Offered
Explore our wide range of cutting-edge technologies.
It's a process for applications that uses software tools to detect issues by observing both the inputs and outputs of a tech stack.